[Latest Update as of January 2026] Favorable Conditions for LMIA Applications for Low-Wage Positions in Canada | Eligible Areas Expand Based on Unemployment Rates
Date Posted:January 12, 2026
Last Updated:January 16, 2026
Index
- 1 A Review of the Relationship Between Low-Wage LMIAs and Unemployment Rates
- 2 Latest Unemployment Rate Data in Effect from January to April 2026
- 3 Cities Where LMIA Applications Are Not Accepted Due to Unemployment Rates of 6% or Higher
- 4 Improved Unemployment Rates in Major Metropolitan Areas in Eastern Canada
- 5 Improving Unemployment Trends in Western Canada
- 6 Impact of This Unemployment Rate Update on LMIA Applications
For foreign workers who wish to work in Canada and for their employers, the Labour Market Impact Assessment (LMIA) is an unavoidable process. Because LMIA applications are heavily influenced by regional unemployment rates, staying up to date with the latest data is extremely important. In this article, we explain in detail how the unemployment rate data applicable from January 9, 2026 to April 9, 2026 will affect LMIA applications.
A Review of the Relationship Between Low-Wage LMIAs and Unemployment Rates
In Canada, the eligibility of LMIA applications for low-wage positions is largely determined by unemployment rates on a city-by-city basis. We previously provided a detailed explanation of the LMIA application restrictions announced on September 26, 2024. If you are not yet familiar with the details of these restrictions, we recommend reading that article first.
Latest Unemployment Rate Data in Effect from January to April 2026
Under the LMIA application restrictions announced by the Government of Canada on September 26, 2024, LMIA applications are no longer accepted in Census Metropolitan Areas (CMAs) with an unemployment rate of 6% or higher. Unemployment rates are updated quarterly. This time, the latest unemployment rate data applicable to LMIA applications submitted between January 9, 2026 and April 9, 2026 has been released.
| Census metropolitan area | Unemployment rate (%) for applications submitted from July 11, 2025, to October 9, 2025 | Unemployment rate (%) for applications submitted from Octorber 10, 2025, to January 8, 2026 | Unemployment rate (%) for applications submitted from January 9, 2025, to April 9, 2026 |
|---|---|---|---|
| St. John’s, Newfoundland and Labrador | 7.2 | 6.8 | 7.1 |
| Halifax, Nova Scotia | 6.2 | 6.1 | 5.2 |
| Moncton, New Brunswick | 6.4 | 7.3 | 5.5 |
| Saint John, New Brunswick | 7.4 | 7.3 | 5.8 |
| Fredericton, New Brunswick | 6.2 | 6.7 | 5.2 |
| Saguenay, Quebec | 4.3 | 4.2 | 4.3 |
| Québec, Quebec | 4.1 | 4.6 | 2.9 |
| Sherbrooke, Quebec | 4.8 | 5.3 | 4.8 |
| Trois-Rivières, Quebec | 5.2 | 5.1 | 3.9 |
| Drummondville, Quebec | 5.6 | 4.7 | 5.6 |
| Montréal, Quebec | 6.9 | 6.7 | 5.5 |
| Ottawa-Gatineau, Ontario/Quebec | 6.4 | 7.7 | 6.8 |
| Kingston, Ontario | 7.2 | 6.6 | 5.6 |
| Belleville – Quinte West, Ontario | 7.1 | 6.6 | 10.6 |
| Peterborough, Ontario | 9.9 | 5.6 | 5.3 |
| Oshawa, Ontario | 9.2 | 9.5 | 8.0 |
| Toronto, Ontario | 8.9 | 9.5 | 7.5 |
| Hamilton, Ontario | 6.6 | 7.6 | 6.4 |
| St. Catharines–Niagara, Ontario | 6.4 | 7.0 | 6.5 |
| Kitchener–Cambridge–Waterloo, Ontario | 6.9 | 7.4 | 8.1 |
| Brantford, Ontario | 6.8 | 9.4 | 8.5 |
| Guelph, Ontario | 5.9 | 9.2 | 7.4 |
| London, Ontario | 6.9 | 7.0 | 7.3 |
| Windsor, Ontario | 11.0 | 11.3 | 7.1 |
| Barrie, Ontario | 7.3 | 7.5 | 8.7 |
| Greater Sudbury, Ontario | 5.4 | 7.0 | 6.0 |
| Thunder Bay, Ontario | 5.1 | 5.1 | 4.2 |
| Winnipeg, Manitoba | 5.6 | 7.3 | 5.7 |
| Regina, Saskatchewan | 5.3 | 6.8 | 6.3 |
| Saskatoon, Saskatchewan | 4.6 | 5.7 | 5.8 |
| Lethbridge, Alberta | 5.2 | 8.5 | 7.2 |
| Calgary, Alberta | 7.3 | 8.0 | 6.3 |
| Red Deer, Alberta | 5.6 | 8.7 | 8.9 |
| Edmonton, Alberta | 7.6 | 9.0 | 6.9 |
| Kelowna, British Columbia | 5.0 | 6.0 | 8.5 |
| Kamloops, British Columbia | 8.7 | 8.6 | 6.6 |
| Chilliwack, British Columbia | 6.3 | 7.8 | 7.3 |
| Abbotsford-Mission, British Columbia | 6.1 | 8.1 | 6.4 |
| Vancouver, British Columbia | 6.3 | 6.8 | 5.9 |
| Victoria, British Columbia | 4.1 | 5.2 | 3.7 |
| Nanaimo, British Columbia | 7.3 | 9.7 | 6.3 |
Only the areas listed here are subject to these rules. Unemployment rates are updated quarterly (April–June / July–September / October–December / January–March).
Cities Where LMIA Applications Are Not Accepted Due to Unemployment Rates of 6% or Higher
According to the latest data, unemployment rates across Canada are generally trending downward. As a result, some major metropolitan areas—such as Montreal and Vancouver—have seen their unemployment rates fall below 6%.
This news article is based on official information from the Government of Canada (Employment and Social Development Canada) and has been organized and summarized in an easy-to-understand format by Visa JP Canada.
This article is a summary prepared by Visa JP Canada based on official information from Employment and Social Development Canada (ESDC), organized for clarity and ease of understanding.
Source: Refusal to process a Labour Market Impact Assessment application (English)
Improved Unemployment Rates in Major Metropolitan Areas in Eastern Canada
In cities across Nova Scotia, New Brunswick, and Quebec, unemployment rates have improved to below 6%. Ontario has also seen improvements of approximately 1–2% in most cities, with some exceptions. As a result, it is now possible to submit LMIA applications for low-wage positions in cities such as Halifax, Montreal, and Winnipeg.
| City | Previous Unemployment Rate | Latest Unemployment Rate |
|---|---|---|
| Halifax | 6.1% | 5.2% |
| Moncton | 7.3% | 5.5% |
| Montreal | 6.7% | 5.5% |
| Toronto | 9.5% | 7.5% |
| Winnipeg | 7.3% | 5.7% |
Improving Unemployment Trends in Western Canada
In Western Canada, including British Columbia and Alberta, many cities still have unemployment rates of 6% or higher; however, overall unemployment trends are improving. Kelowna stands out as an exception, with its unemployment rate increasing sharply by 2.5%.
| City | Previous Unemployment Rate | Latest Unemployment Rate |
|---|---|---|
| Edmonton | 9.0% | 6.9% |
| Abbotsford–Mission | 8.1% | 6.4% |
| Vancouver | 6.8% | 5.9% |
| Red Deer | 8.7% | 8.9% |
| Kelowna | 6.0% | 8.5% |
Vancouver’s Unemployment Rate Falls Below 6% — A Major Step Toward Resuming LMIA Applications
While British Columbia and Alberta as a whole are experiencing declining unemployment rates, the most notable development in the latest data is that Vancouver’s unemployment rate has fallen below 6%. In the previous reference period, Vancouver’s unemployment rate stood at 6.8%, but it has now improved to 5.9%, making the metropolitan area once again eligible for LMIA applications for Low-Wage Positions.
At the same time, some areas within British Columbia—such as Kelowna—have seen rising unemployment rates, making it essential to continue checking eligibility on a city-by-city basis.
Impact of This Unemployment Rate Update on LMIA Applications
Although there are still major metropolitan areas—particularly in Ontario, Alberta, and British Columbia—where unemployment rates exceed 6%, the overall trend across Canada is downward. Until April 9, 2026, the number of regions accepting LMIA applications for low-wage positions has increased, including Halifax, Montreal, Winnipeg, and Vancouver.
Related Columns

Date Posted:December 16, 2025
10 Critical Mistakes That Can Jeopardize Your PGWP Application— The 180-Day Rule and the Reality of Processing Delays

Date Posted:September 11, 2025
BC Premier Calls for Temporary Foreign Worker Program to Be Abolished or Fundamentally Reformed — Industry Pushback and What Lies Ahead

![[Co-op Work Permit in Canada] How long can you work? Employment conditions and points to be cautious of to avoid illegal employment](https://en.visajpcanada.com/wp-content/uploads/2025/04/Blog-Thumbnail-94.webp)
Related News
Looking to obtain permanent residence or a visa?
Consult with us now!

Applying for permanent residence or a visa to Canada on your own can be overwhelming due to the large number of required documents, and you may feel uncertain about whether everything is correct. However, if you're serious about immigrating to Canada, we strongly recommend seeking the support of an immigration consultant. There are many pathways to obtaining permanent residence, depending on factors such as your age, occupation, and family status. With the help of an expert, you can ensure that you plan the right approach tailored to your specific situation.
A professional immigration consultant will help solve your concerns
Get a free Counseling now
From immigration planning to application submission,
everything is completed with Visa JP Canada
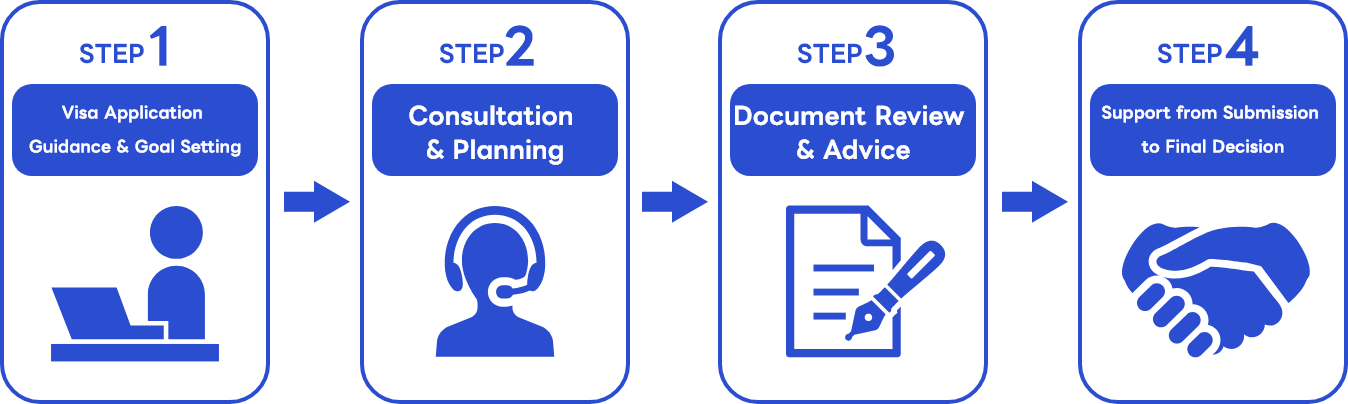
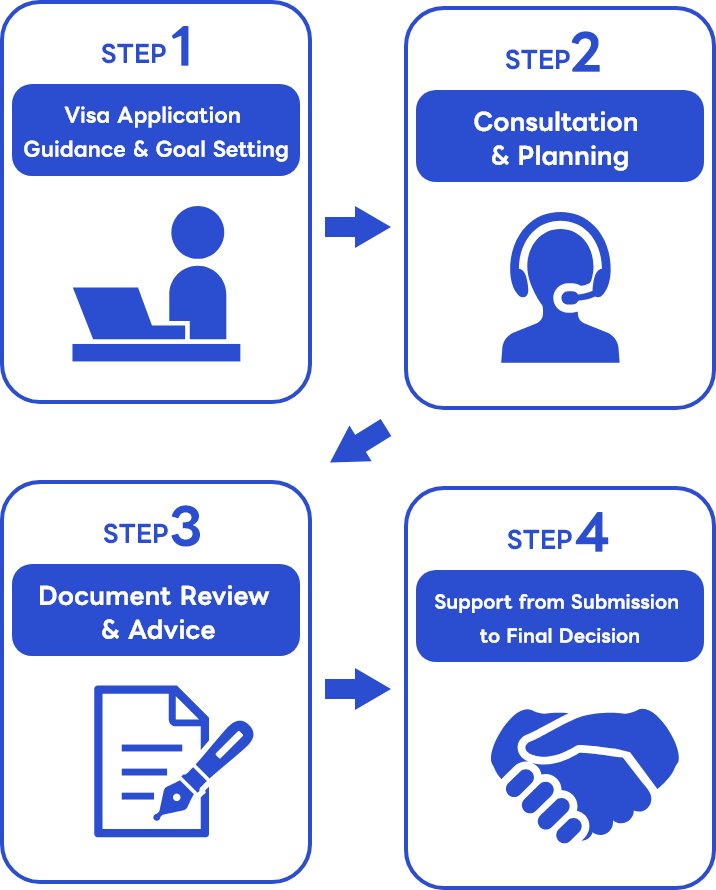
Consulting with an immigration consultant makes the process clearer and much smoother. You’ll feel more confident with document submissions and procedures, significantly reducing the risk of mistakes. Take the first step toward your Canadian dream with the guidance of an expert.